
Receiver Operating Characteristic (ROC) Curve
- Stardat
- Jun 8, 2020
- 2 min read
Receiver Operating Characteristic Curve is a graphic way to evaluate the model performance and the trade-offs under different working points.
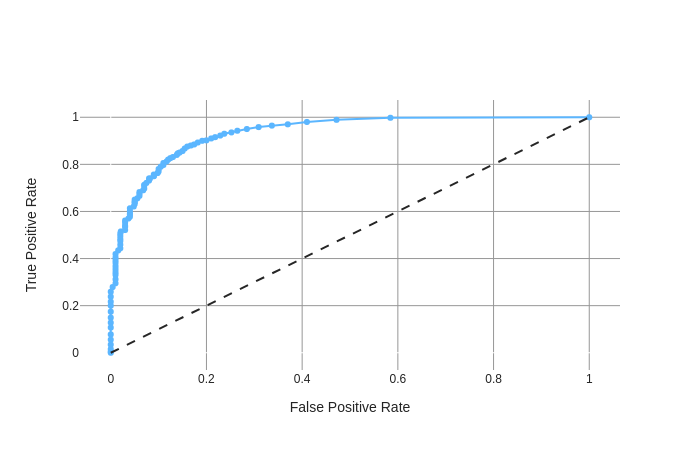
A receiver operating characteristic curve, or ROC curve, is a plot that illustrates the diagnostic ability of a binary classification system as its discrimination threshold (or working point) is varied, where the predictions of the model are on a scale of zero to one. The x-axis is the False Positive Rate (FPR) or false alarm rate, and the y-axis is the True Positive Rate (TPR) or recall. The data points show the ratio of the rates for different working points, between 0.0 and 1.0.
The FPR, also referred to as the inverted specificity, is calculated as the number of false positives divided by the sum of the number of all negative samples in the data.
The TPR, also referred to as the hit rate, recall and sensitivity, is calculated as the number of true positives divided by the sum of all positive samples in the data.
The ROC curve is a useful tool for a few reasons:
Comparing different models - The curves of different models can be compared either generally, or for specific thresholds
The area under the curve (AUC) can be used as a summary of the model performance (ranges between 0.5 which is equal to a random classifier to 1.0 which achieves perfect separation)
The shape of the curve contains a lot of information, including what we might care about most for a problem - the expected FPR, and the false-negative rate: Smaller values on the x-axis (FPR) of the plot indicate lower false positives and higher true negatives. Larger values on the y-axis (TPR) of the plot indicate higher true positives and lower false negatives. Therefor a sharp rise of the curve is highly desirable.


Comments